If you’re monitoring your VPS through the GreenGeeks Dashboard and notice your memory usage looks high, don’t panic, your server is likely running just fine.
The GreenGeeks Dashboard reports total memory usage including cache, which Linux uses aggressively to improve performance. This is normal, expected behavior.
Why Does Linux Use So Much Memory?
Linux is designed to make use of available RAM by caching frequently accessed files and data in memory. This cache speeds up your server by reducing the need to read from disk repeatedly.
Crucially, this cached memory is immediately released whenever a running application needs it, it’s not “used up” in any meaningful sense.
This behavior is so commonly misunderstood that there’s a dedicated resource explaining it: https://www.linuxatemyram.com
The short version: memory that appears “used” in a dashboard may largely be disk cache, and that’s a good thing.
How to Check Your Actual Memory Usage
For an accurate picture of your server’s real memory consumption, log into WHM and navigate to the live memory report:
WHM -> Server Status -> Current Memory Usage
This view breaks down memory into meaningful categories — including how much is genuinely allocated to running processes versus how much is simply being used as cache.
When reviewing this output, most important metric is “available” column. Available indicates memory that would be free for another application if needed, even if it’s currently in use for Disk Cache.
Current Memory Usage
Here’s an example of the Current Memory Usage in WHM:
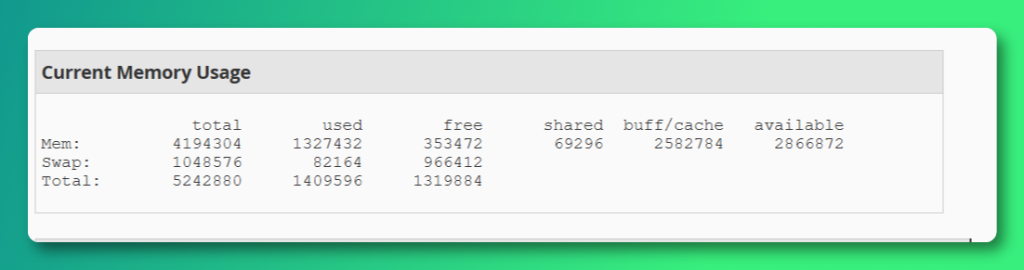
We can see the VPS has 4GB overall memory(note that the output is in bytes by default); 1.2GB is actually in use, leaving approximately 2.8GB free for other applications.
You can see the same information by logging into SSH and running the free -m command.
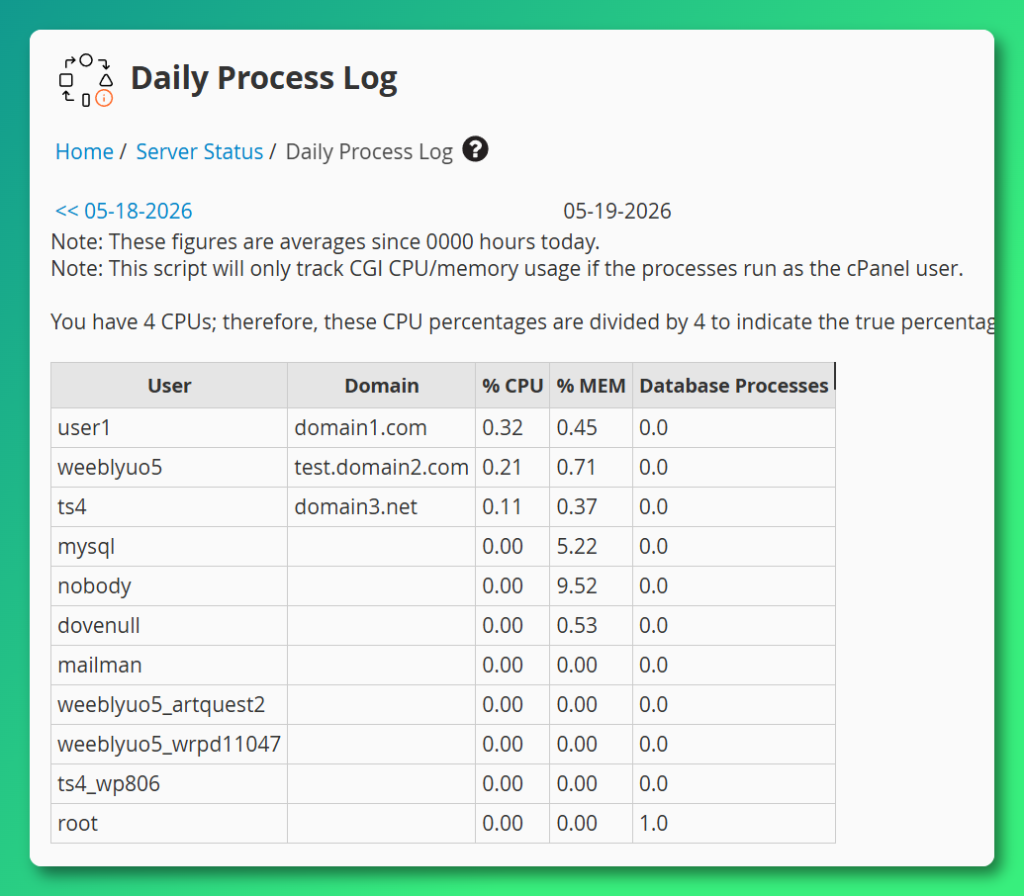
Daily Process Log
If after reviewing WHM’s memory report you see that application memory (excluding cache) is genuinely near or at your plan’s limit, you may want to review the WHM -> Server Status -> Daily Process Log
The Daily Process Log provides insight on the overall CPU/MEM usage on a per-user basis, over a 24 hour period. Because this is a 24-hour average, it drastically smooths out massive spikes.
Your log might look perfectly healthy at 1%, but your site could have actually crashed or slowed to a crawl during a 15-minute traffic spike.
What to Look For
| Memory Type | What It Means |
|---|---|
| Used (applications) | Memory actively consumed by running processes |
| Cache/Buffer | Memory held by Linux for faster disk access — freely reclaimable |
| Free | Memory not currently in use at all |
A server with low “free” memory but high “cache” is normal and healthy. Only be concerned if memory used by applications is consistently near your plan’s limit.
When to Actually Be Concerned
If after reviewing WHM’s memory report you see that application memory (excluding cache) is genuinely near or at your plan’s limit, you may want to:
- Review which processes or users are consuming the most memory
- You can use WHM -> Server Status -> Daily Process Log to get a snapshot of the average daily use of CPU/MEM resources, broken up by user account.
- Consider optimizing your application configuration; review your application caching configuration.
- Evaluate whether a VPS plan upgrade is appropriate.
If you’re unsure how to interpret what you’re seeing, the GreenGeeks VPS Support Team is happy to take a look, just open a Support Ticket from your GreenGeeks Dashboard.
Summary
The GreenGeeks Dashboard includes cache in its memory reporting, which can make usage appear higher than it truly is.
Always use WHM -> Server Status -> Current Memory Usage for an accurate, detailed breakdown of how your VPS memory is actually being consumed.