Heatmaps are visual representations of website visitor data. They give you insight into what visitors do on your site, where they click, and how far they scroll. If you use WordPress, the Aurora Heatmap plugin is a great way to see what a heatmap can do.
Website heatmaps show you the most popular and unpopular sections of a page. It represents an aggregate of user behavior over a given period of time.
Heatmaps are a unique presentation in the world of website statistics. Most other statistics provide information on which pages were visited and for how long. Heatmaps give you an idea of what visitors did while they were on the page.
Aurora is a free heatmap plugin that will work on any WordPress website. Let’s install it and take a look at what it has to offer.
Installing the Aurora Heatmap Plugin
Log in to your WordPress admin panel.
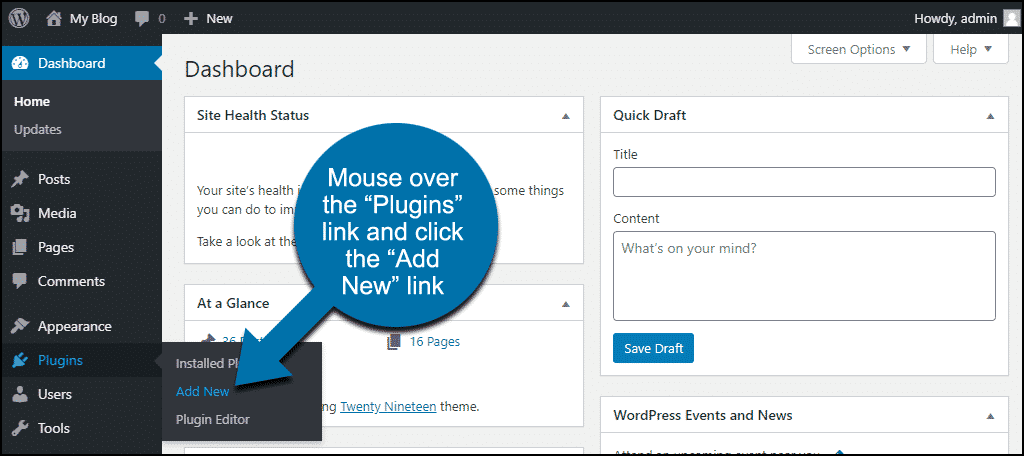
In the left column navigation, mouse over the “Plugins” link and click the “Add New” link.
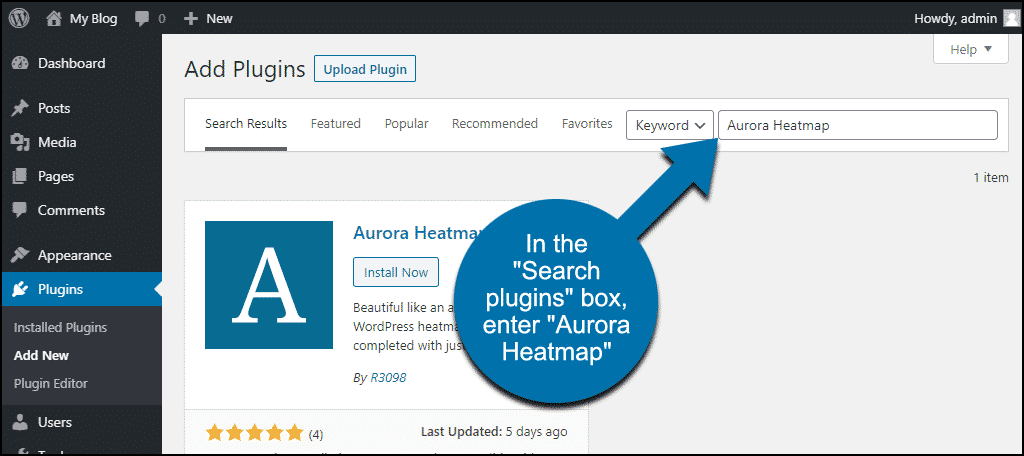
In the “Search plugins…” box, enter, “Aurora Heatmap.”
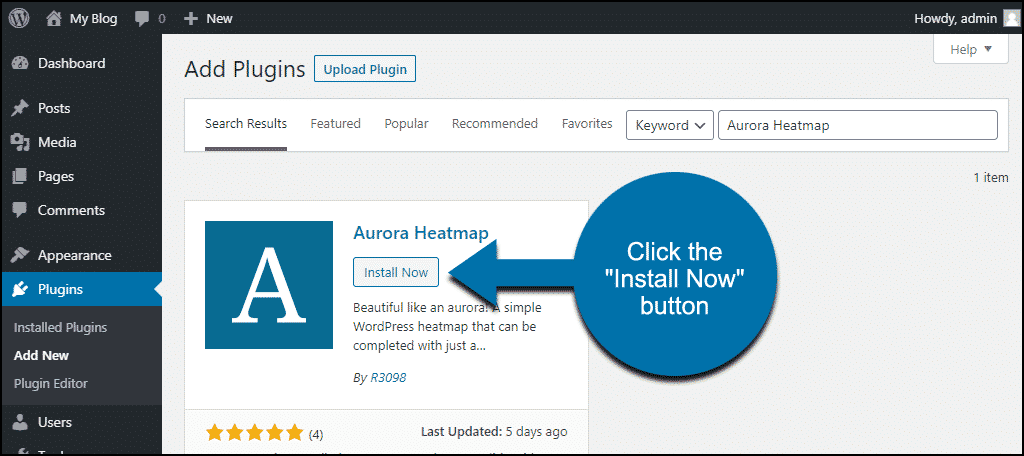
When you find the plugin, click the “Install Now” button.
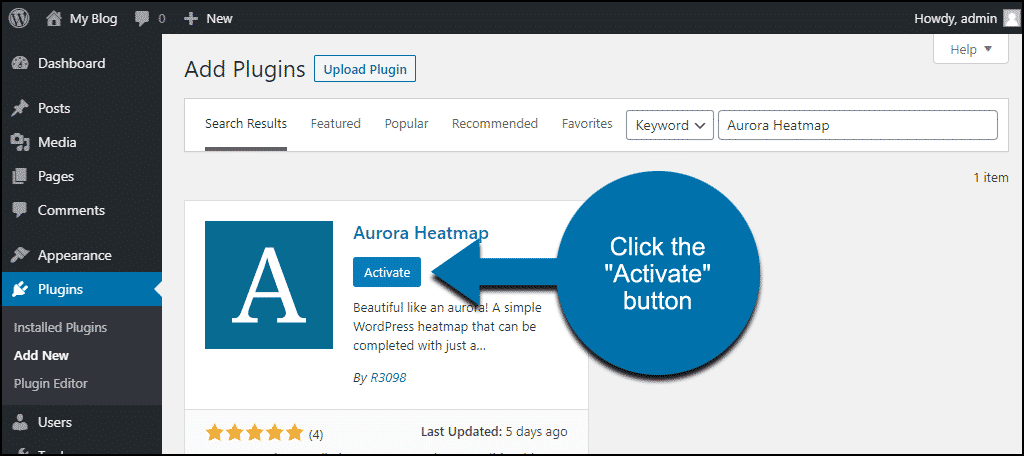
Now the plugin is installed, but it has to be activated before you can use it.
Click the “Activate” button.
That’s all there is to it. The plugin has already started gathering data.
Configuring Aurora Heatmap
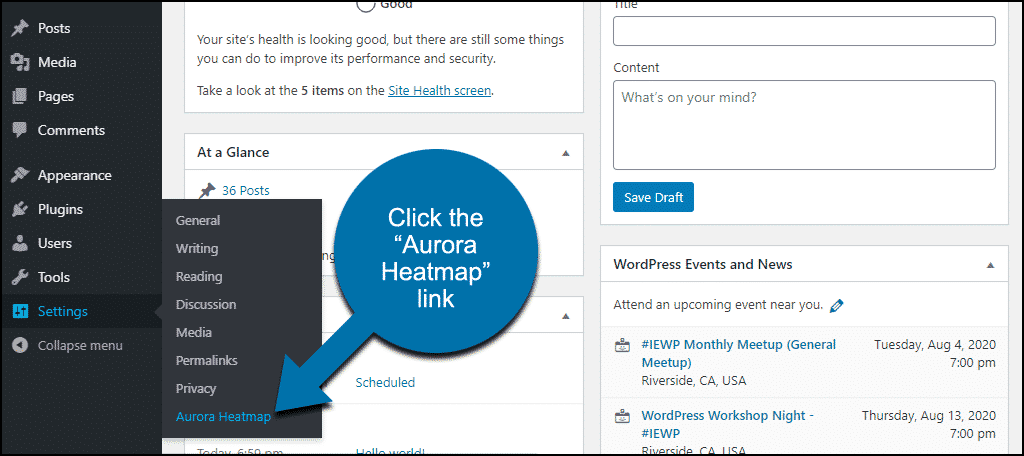
In the left column navigation, mouse over the “Settings” link and click the “Aurora Heatmap” link.
The “Heatmap List” tab won’t have any data on it immediately after installing the plugin. It takes some time to collect enough data to display a map. How much time depends on your blog traffic.
The WordPress Aurora Heatmap does not log admin visits. So you can’t click around and create a heatmap yourself unless you’re logged out of your WordPress admin dashboard.
So before looking at a heatmap, let’s check out the plugin configuration options.
Click the “Settings” tab.
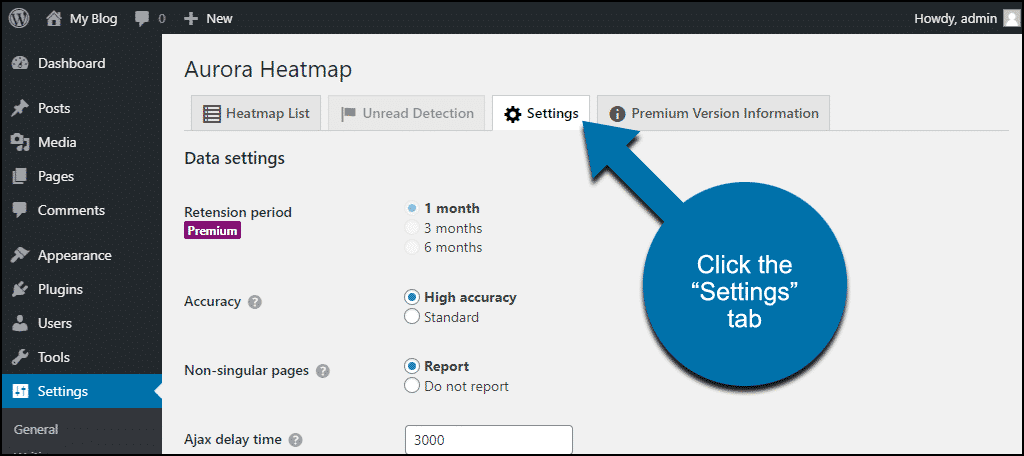
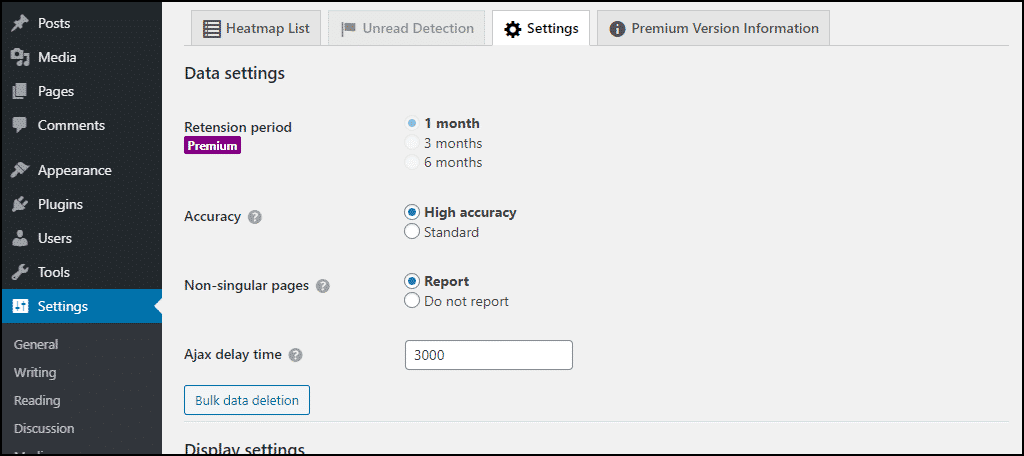
Data settings
- Accuracy is the number of data points used to create the map. Sites with fewer visitors may want to choose the “Standard” setting. Otherwise, leave it set to the default “High accuracy.”
- Non-singular pages – choose whether to include “non-singular” pages in the report. Non-singular pages are archives, search results – pages with more than one article or links to multiple articles.
- Ajax delay time – time in milliseconds before the plugin starts logging activity. The delay helps ensure all the supporting page scripts are loaded.
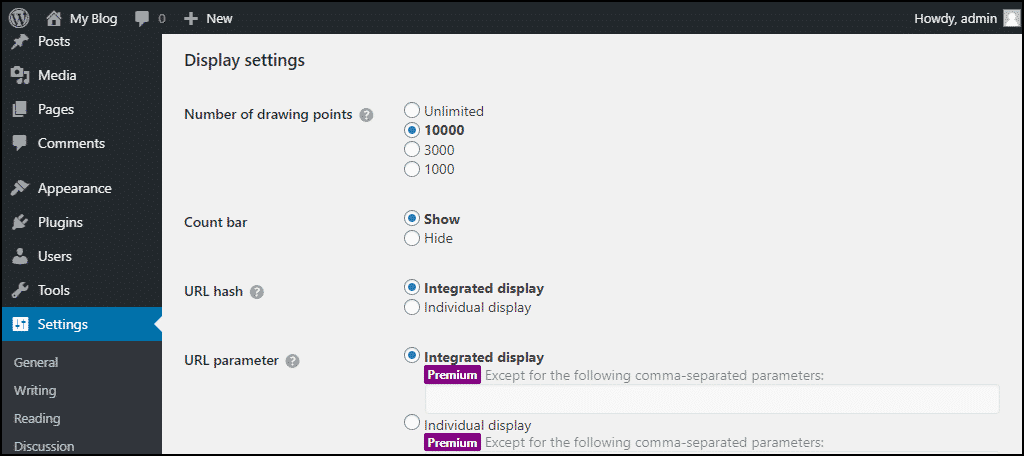
Display settings
- Number of drawing points is the amount of data included in the map. Depending on what you’re looking for, too much data can reduce the effectiveness of a heatmap. In other (or most) circumstances, you want all the data you can get. Remember, the purpose of a heatmap isn’t to count visitors. It’s to analyze their behavior.
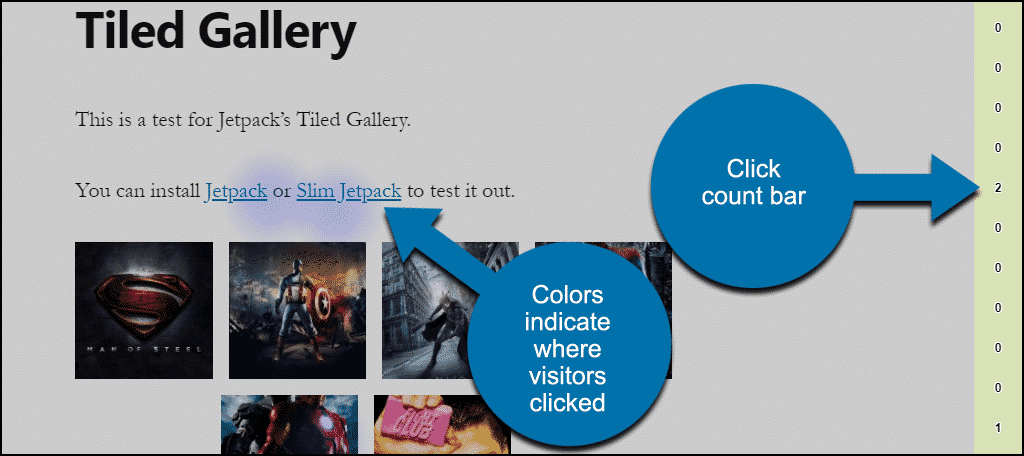
- Count bar runs vertically along the edge of the heatmap results page. It shows the number of clicks on the line. You can disable it here, but it’s a handy feature, so leave it set to “Show.”
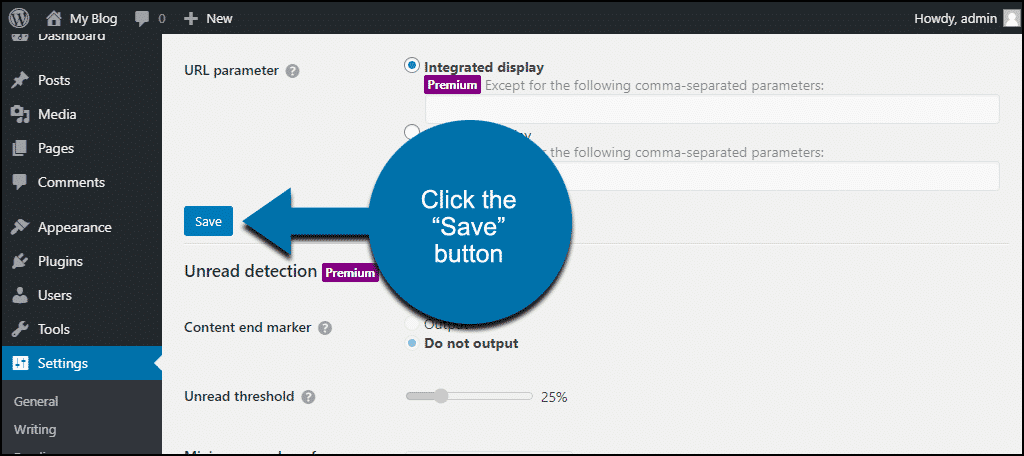
- URL hash – if you use anchor links, you can choose whether to count the link as a separate page. Individual display treats this URL as a separate page: ggexample.com/blog/article#important-point. Integrated display combines the data for ggexample.com/blog/article#important-point and ggexample.com/blog/article (without the hash URL)
If you make any changes here, be sure to click the “Save” button.
These are the options for the free version of the plugin. There are additional options if you buy the premium version of Aurora Heatmap.
The Heatmaps
Now for the fun part, the heatmaps themselves.
To open a heatmap, click the “Heatmap List” tab.
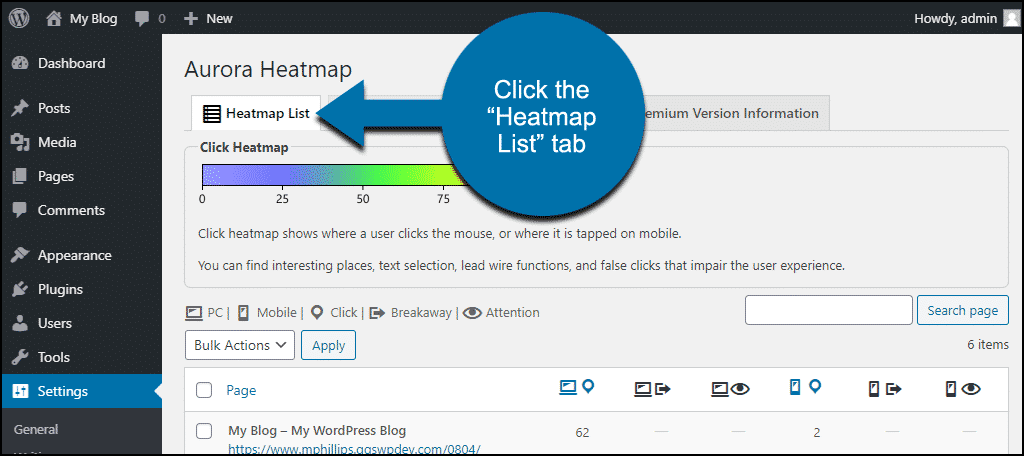
The free version of the plugin counts clicks. So there are two views for each heatmap, desktop clicks, and mobile taps.
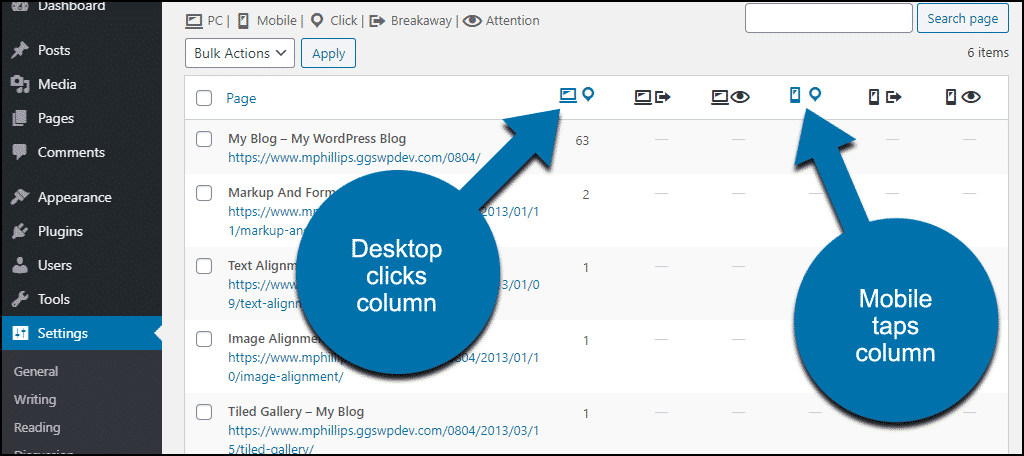
Click the number to the right of the URL in the list to open the heatmap.
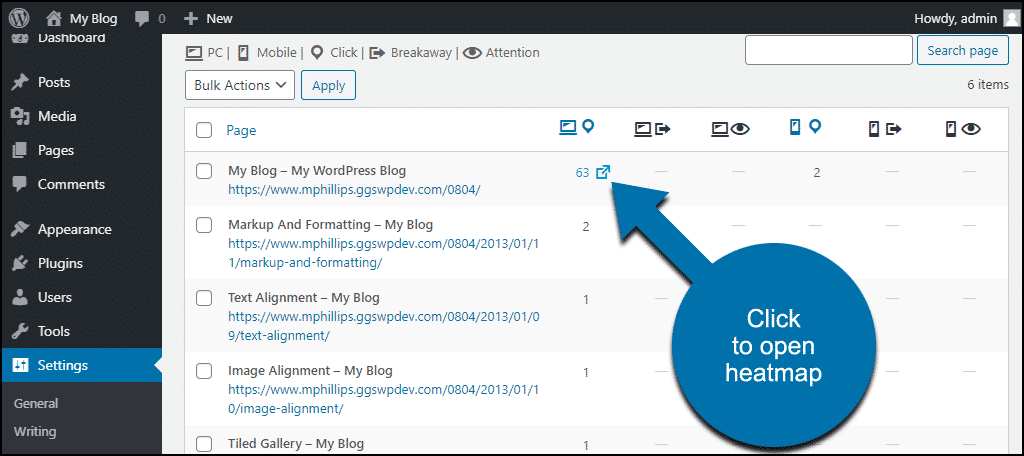
A new window will open, displaying the heatmap. You can see the colored areas where a visitor clicked, and the number of clicks in the count bar.
One of the things you might not expect to see if you’ve never used heatmaps before is this:
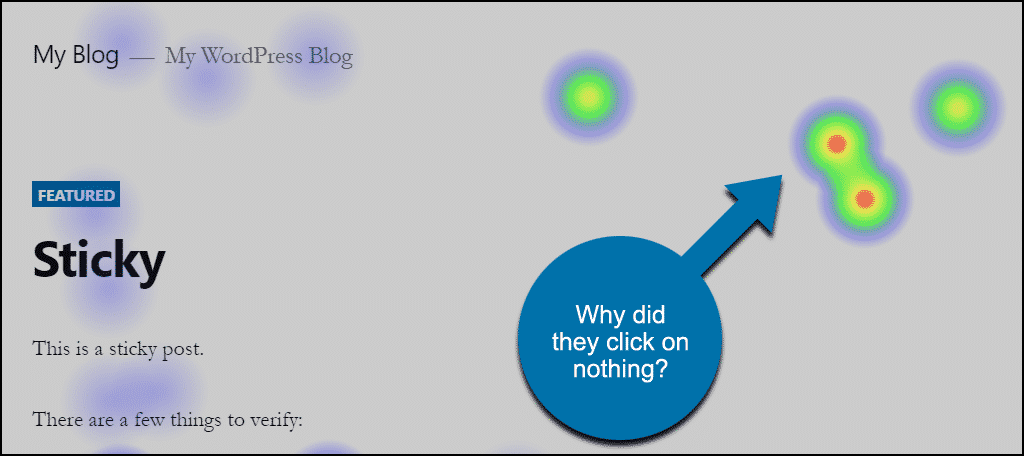
Yes, those are clicks in empty areas. No link, no picture.
But you’ll see those in just about every heatmap. More often than not, they’re accidental. But if you see a lot of clicks on an item that isn’t clickable, it could indicate a problem.
You may have an element that appears to be clickable but isn’t. You should do what you can to change that.
Or, you may have a small image on a page that people click in order to see a larger version. In those cases, you should consider linking to a larger version of the image. Your users are demonstrating with their clicks that they want to see a larger version.
This WordPress Heatmap Plugin Is Cool, but What Can I Really Get From It?
Do you have an important link on your website? Perhaps a buying link or a newsletter sign up? Wondering how to improve its performance? A lot of factors affect link performance, but a heatmap can help you see if the location is a problem.
Much of a heatmap’s value lies in the “cold” areas of the map. Where the links and page elements that aren’t getting any attention.
You’ll notice that behavior on just about every page follows some general patterns. Most visitors concentrate on the upper left part of a page. That’s interesting because it’s not necessarily the “visual center” of a page.
Our eyes naturally gravitate to an area slightly to the upper right of the center of what we’re looking at. But we focus our attention in different places when looking at a photograph and a page of text.
We may be predicting where visitors will look, but we never really know. A heatmap on a website shows us where people interact with the page. That may not be where they look first, but it’s where the action is.
So if your map is “cold” around an important link or element, you have two options. One, you can try to attract attention to the important element to create a new hot zone. Or two, you can move the important element to a part of the page that you know visitors interact with.
As you can imagine, it’s easier to move the important page element into the action. It’s more difficult to draw visitor’s attention to a cold part of a page. Which isn’t to say it can’t be done. It’s possible to draw attention to any part of a page. But the quick fix is to move things into the hot zone.
What Happens if You Uninstall the Aurora Heatmap Plugin
If you uninstall the plugin, you will no longer be able to view heatmaps.
If you delete the plugin, you will no longer be able to view heatmaps. The database tables created by the plugin will be deleted, and the data collected by the plugin will be lost.
The above issues are what we found in our testing. There may be other issues our testing did not uncover.
Which Came First, the Heatmap, or the Website?
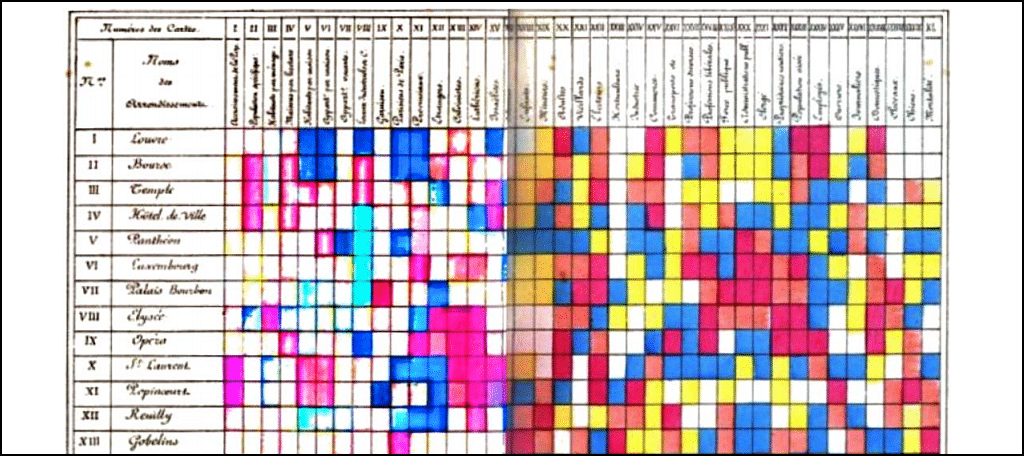
Website heatmaps are advanced web technology, but they aren’t new technology. Statisticians and scientists have used different forms of heatmap-like graphic representation to visualize data for hundreds of years.
Like this 1870s “heatmap” that displays data about the different districts of Paris.
Humans are always looking for a way to “see” numbers, and heatmaps let us do just that. Have you ever used heatmaps on a website or blog? Have you made changes to the site based on heatmap results?
I’d love to hear from you. Let me know in the comments.